My cellphone chirps with a text message. I glance down. “Oh no!” I think. “It’s from Bob.” Fellow meteorologist Bob Henson has been my partner for many years in extreme weather blogging, and I always read his text messages with a mix of trepidation and eagerness. “What fresh hell does the atmosphere have in store for us?” I wonder, on this June day in 2021, as I view Bob’s text.
“Have you seen the latest Euro model?” the message says. “It’s showing a 4-sigma ridge developing over the Pacific Northwest and SW Canada!” He links to this Tweet:
I consider the map with consternation, then bring up other model maps to check the veracity of the prediction. Wow. Some truly outlandish heat is forecast for the region of an extremity never observed anywhere in world history. I text back. “Hmm,” I say. “Seems improbable. But the GFS model is on board too, so we have to take it seriously.”
Sure enough, a few days later, the historic late-June 2021 heat wave in western North America broke more all-time heat records by five degrees Celsius (9°F) than any global heat wave since at least 1936, according to weather records expert Maximiliano Herrera. The 2021 heat wave was blamed for 1,037 deaths and smashed Canada’s all-time national temperature record on three consecutive days at Lytton, British Columbia, where temperatures topped out at a stunning 49.6°C (121°F) on June 29 — a day before the town burned down in a ferocious wildfire fed by the extreme heat.
The above event, as paraphrased from memory, is but one example of what has been an increasingly common type of interaction between Bob and me — marveling at and dreading the arrival of an extreme weather event that used to be impossible. Indeed, a rapid-response study from the World Weather Attribution initiative found that the June 2021 heat wave would have been “virtually impossible without human-caused climate change.”
So what’s up with the weather? Because weather is naturally extreme, could the extraordinary weather events in recent years be caused mostly by natural variability, with the expansion of the internet and media hype altering our perception of the weather? Undoubtedly, increased awareness of extreme weather can play a role in the perception that the weather is getting more extreme.
But all weather is now occurring in an atmosphere fundamentally altered by global warming. Heat is energy. More heat in the atmosphere means that there is more energy to power extreme weather events. Moreover, the extra heat energy from human-caused global warming has fundamentally disrupted atmospheric circulation patterns. The combination of more heat energy and a disrupted atmospheric circulation has made extreme weather events more common and more intense, a phenomenon climate scientist Katharine Hayhoe calls “global weirding.” The resulting weather disasters are severely stressing a society constructed for the old, somewhat calmer climate of the 20th century.
Consider climate change in terms of ice age units
Since the preindustrial times of the mid-1800s, Earth’s climate has warmed by about 1.2 degree Celsius (2.2°F). That may seem like a trifling amount until one considers the difference in global temperature today compared to the last Ice Age, when mammoths roamed the Earth and sea levels were 300 feet lower.
The average global temperature difference between then and now is about 6 degrees Celsius (11°F), or what we can call one “ice age unit.” By that definition, people have already warmed the Earth by 20% of an Ice Age unit. Troublingly, current policies have us on track to warm the planet by about 2.7 degrees Celsius — nearly half an Ice Age unit — by the end of this century, as climate scientist Andrew Dessler explains in the Tweets above.
Thus, 1.2°C of warming is very significant, particularly considering that over land areas — where people live — the warming has been greater, about 1.7 degree Celsius (3.1°F). And over Northern Hemisphere land areas, the warming has been even higher, about 1.9 degree Celsius (3.4°F).
More heat means more energy to power heat waves, droughts, and wildfires
When weather patterns favor a dry pattern, global warming will cause the heat waves that occur during those dry periods to be more intense. And since warmer air can hold more water vapor, soil and plants will lose more moisture to the air, causing increased drying, more frequent and more intense droughts and higher wildfire risk. A large volume of research now connects human-caused climate change to increased heat, drought, and wildfires, leading to impacts already beyond what was anticipated even 20 years ago.


More heat means more energy to power storms
When weather patterns favor storms, global warming increases the heat energy available to storms. This extra heat energy can be converted to the kinetic energy of their winds, driving more wind and storm surge damage.
Moreover, heat-charged storms will also be able to dump more precipitation, since a warmer atmosphere can hold more water vapor. Each degree Celsius the atmosphere warms increases the amount of water vapor that can be present by 7%, leading to more intense heavy precipitation events. And when that extra water vapor condenses inside a storm, the “latent” heat required to evaporate the water is released, invigorating the storm, allowing it to grow larger and stronger and pull in even more moisture.
Globally, atmospheric water vapor has increased 5-20% since the 1960s, and this is a primary factor in the increase in heavy precipitation events in most regions of the world in recent decades.
It’s increasingly common to see 500- or 1000-year flood events identified and publicized right after their occurrence, as radar-based precipitation estimates are digitally compared to existing databases. Some of these extremes may seem more commonplace now simply because they’re easier to calculate and disseminate quickly than they once were. However, there’s also plenty of research to support the conclusion that heavy precipitation is in fact becoming more extreme.
For example, compared to the relatively stable climate period of 1951-1980, 24-hour precipitation records increased by 30% globally by 2016, with one-sixth of that increase occurring from 2007-2016, according to one recent paper. But while extreme precipitation has generally been increasing globally, there are important regional and seasonal variations. For example, subtropical dry regions, like the western U.S., southern Africa, and to a lesser extent the Mediterranean and Australia, have seen lower increases in rainfall records than wet regions in the tropics and mid-latitudes.
Furthermore, an increase in extreme precipitation does not always translate to an increase in extreme flooding. Floods are influenced by a variety of factors, including, very importantly, how wet the soils are. A 2015 study in the journal Climatic Change found that very heavy precipitation — in the 99th percentile — in the contiguous U.S. resulted in 99th-percentile flooding only 36% of the time. The odds of 99th-percentile flooding increased to 62% when the soils were already moist, though.
An increase in mean temperature leads to a massive increase in the probability of extreme heat
The probability of experiencing a particular temperature can be plotted on a graph that resembles a bell-shaped curve with the most probable temperatures forming the thick main part of the bell and the less probable extremes forming the curved edges of the bell (see the four-part Tweet below). Because of the nature of statistics, the seemingly modest increase in global temperature in recent decades has led to a massive increase in the probability of extreme heat events (also called “long tail” events, because they reside on the trailing right-hand side of the bell-shaped curve of temperature distribution).
Compared to the relatively stable climate period of 1951-1980, by the decade of 2001-2010, monthly extreme heat events that would be expected to occur once every 1,000 years (a 0.1% chance in a given year) were now occurring once every 20 years — a factor-50 increase. By the decade of 2011-2020, these events had seen a further increase — by a factor of 90 over the 1951-1980 period, occurring nearly once per decade. Furthermore, extreme heat events that were essentially impossible in the old climate — with a probability of 0.003% in a given year — had become a factor of 1,000 more likely, with a 3% chance of occurring in a given year. The incredible 2021 western North America heat wave was one such event.
Because temperature ranges tend to be more restricted in the tropics, a small increase in temperature can have a much greater impact on ecosystems and people there. When analyzed in this way, tropical regions have experienced the largest frequency increases in heat extremes.
The Arctic is warming nearly four times faster than the rest of the globe
Where a few degrees of warming really make a difference is in places with typical temperatures close to the freezing point of water, since a small change in temperature can mean the difference between a frozen and melted state — for example, in the summer in the Arctic. The Arctic Ocean is mostly covered in sea ice, but global warming has led to approximately a one-third drop in summer sea ice coverage since 1979 — and likely a 50% drop over the past century — because of a vicious cycle called Arctic amplification. A key part of this vicious cycle is that ice melting reveals dark seawater underneath, which absorbs more sunlight and causes more warming.
Since 1979, Arctic amplification has caused the Arctic to warm nearly four times faster than the rest of the globe, and the Arctic is about 3 degrees Celsius (5.4°F) warmer than in 1980. Areas in the Eurasian sector of the Arctic Ocean have warmed up to seven times as fast as the globe.
Extreme weather is increasing because of atmospheric circulation changes
Unfortunately, the loss of Arctic sea ice is thought to be significantly affecting the global atmospheric circulation. The jet stream — the high-altitude band of winds that circles the globe and modulates much of the weather we experience at mid-latitudes — is driven by the difference in temperature between the regions near the equator and the poles.
The Arctic is warming nearly four times faster than the rest of the planet, which tends to cause a slowing of the jet stream winds and increases the jet stream’s tendency to make contorted high-amplitude loops that remain stuck in place for extended periods (see video explainer below from Peter Sinclair). This change leads to more intense and longer-duration heat waves, droughts, flooding events, and cold snaps.
A summertime jet stream pattern that causes dangerous persistent extreme weather events is called quasi-resonant amplification, or QRA. That pattern has seen a doubling in frequency in recent decades, and this increase has been linked to Arctic sea ice loss.
The impact of Arctic sea loss and Arctic amplification on atmospheric circulation is an area of active scientific research, and other factors may be causing the increase in unusual jet stream behavior. Climate models have a difficult time replicating the observations, and the first theoretical study giving a good understanding of the issue wasn’t published until a few months ago.
Significant atmospheric circulation changes causing an increase in extreme weather are also potentially occurring because of a wide variety of other human-related factors.
Deforestation alters the location and amount of moisture in the air; it also changes the reflectivity of the planet, altering how much sunlight goes into and out of the atmosphere. Fine particle pollution, called PM2.5, reflects sunlight and encourages cloud formation, causing significant impacts on regional weather. For example, high levels of fine particle pollution emitted from the U.S. and Europe are thought to be the primary cause of an atmospheric circulation change — a southward shift of the tropical rain belt called the Intertropical Convergence Zone — that led to the central African drought of the 1970s and 1980s, which killed over 500,000 people. After legislation to limit such particle pollution was passed in the U.S. and Europe in the early 1990s, the tropical rain belt shifted back to its former state, and the drought lessened. More recently, high emissions of small pollution particles over Asia have been linked to a weakening of the monsoon and an increase in intensity of the Arabian Sea tropical cyclones.
Tornado seasons are becoming more variable
Climate change may be influencing how tornadoes and tornado outbreaks are clustered. Because tornado formation depends on a complex set of ingredients in and around a single thunderstorm, there is no sign that climate change is tending to make tornadoes stronger or weaker on average.
However, it appears that U.S. tornadoes are tending to occur in larger outbreaks more often, with longer “dry spells” in between, not unlike the tendency for rainfall to be concentrated into heavier extremes.
There are also signs that hotter, drier air from the Southwest is helping to shift tornado activity toward the Mississippi Valley and Mid-South, farther east than the traditional Tornado Alley of the Great Plains. This shift has major safety implications, as the Southeast U.S. is more vulnerable to tornadoes than the Plains in several ways, including having a higher likelihood of nighttime tornadoes. And the last several years, including the two devastating tornado outbreaks of December 2021 and the active twisters of January 2023, suggest that a warming winter atmosphere could be allowing for more cold-season tornadoes farther north than they are traditionally observed.
A meteorologist’s perspective
The broad outlines of global climate change have been mapped out since the 1990s, and we are continuing to learn about its many ominous manifestations in extreme weather events.
The picture is not complete, though. In 2004, Harvard climate scientists Paul Epstein and James McCarthy concluded in their paper Assessing Climate Stability: “We are already observing signs of instability within the climate system. There is no assurance that the rate of greenhouse gas buildup will not force the system to oscillate erratically and yield significant and punishing surprises.”
Examples of such punishing surprises include Hurricane Sandy of 2012 and the immense jump in catastrophic western U.S. wildfires in recent years.
As the climate continues to warm and the atmospheric circulation further destabilizes, climate change will increasingly bring low-probability, high-impact weather events — “black swan” events — that no one anticipated. As the late climate scientist Wally Broecker once said, “Climate is an angry beast, and we are poking at it with sticks.”
And sometimes Earth itself will throw a curve ball, as in the eruption of the Hunga Tonga–Hunga Haʻapai volcano in January 2022. Along with producing a spectacular swarm of 400,000 lightning flashes on a single day, it’s possible that this eruption threw enough water vapor into the stratosphere to temporarily alter global circulation patterns and even enhance global warming over the next several years.
We need to anticipate and prepare for a significant increase in extreme weather in the coming years as we head toward half of an Ice Age unit of total climate warming. As we discussed in a post last year, The future of global catastrophic risk events from climate change, a U.N. report found that climate change is steadily increasing the risk of rare extreme events that can kill more than 10 million people or lead to damages of $10 trillion-plus, posing threats of total societal collapse.
The good news is that clean energy and other climate solutions are abundant and available, and we can act with urgency to rein in the climate emergency and stabilize our climate once again.
Related posts
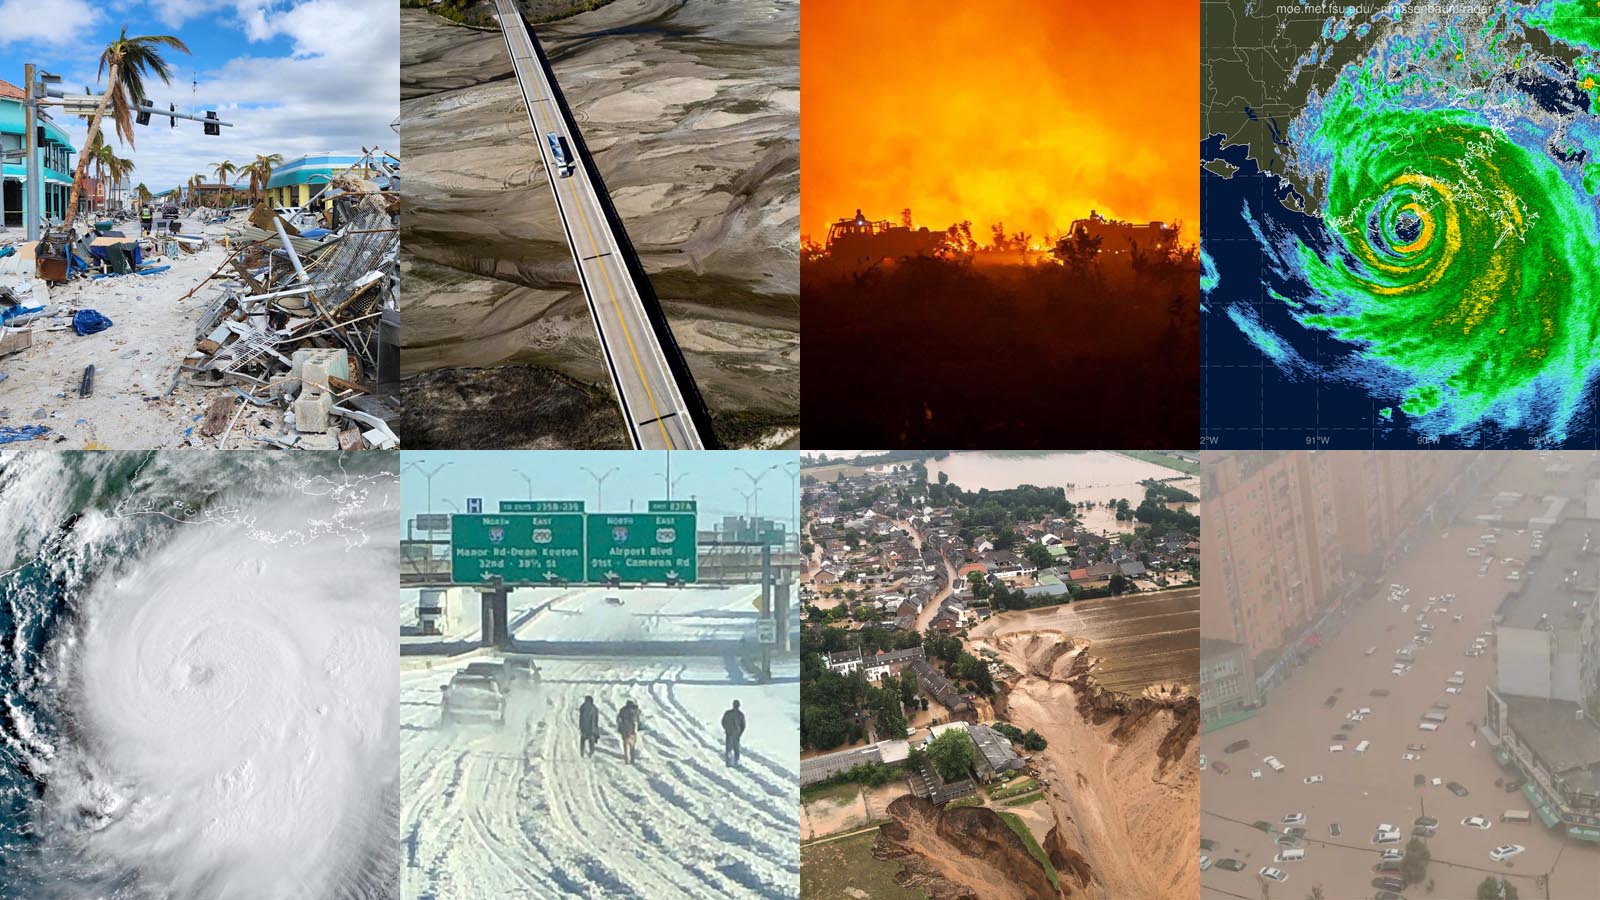
Featured image credit, clockwise, from upper left: Damage in Fort Myers Beach, Florida, on October 21, 2022, after Hurricane Ian (Image credit: Michael Lowry). The drought-stricken Platte River downstream from Kearny, Nebraska, on October 17, 2022 (Image credit: Craig Chandler, University of Lincoln, Nebraska). A wildfire in western France on July 17, 2022, during a heatwave that broke many all-time heat records in the region (Image credit: Matthieu Penz,la Fédération nationale des sapeurs-pompiers de France). Radar image of Hurricane Ida making landfall at Port Fourchon, Louisiana, on August 29, 2021 (Image credit: Mark Nissenbaum/Florida State University). Extreme flooding in Zhengzhou, China, on July 20, 2021, after over 25 inches of rain fell in 24 hours (Image credit: UN Climate Change Twitter feed). Flood damage in western Germany’s Rhein-Erft-Kreis district, July 16, 2021 (Image credit: BezirksregierungKöln). Pedestrians walk on a snow-covered expressway in Austin, Texas, on February 16, 2021 (Image credit: Texas DOT, Austin). Hurricane Laura approaching Louisiana on August 26, 2020 (Image credit: NOAA/RAMMB).
Website visitors can comment on “Eye on the Storm” posts (see comments policy below). Sign up to receive notices of new postings here.
Source link