An intense low-pressure system brought an atmospheric river of water vapor and torrential rains to southern British Columbia and northwestern Washington state on Monday, generating devastating flooding that virtually isolated the city of Vancouver from the rest of Canada. The floods came less than five months after the most extreme heat wave in global history affected the same region, fueling destructive wildfires.
Flooding and landslides from Monday’s storm cut the three main highways connecting the city of Vancouver, located on the Pacific coast, with the interior portions of Canada. Damage to some of these highways was extreme, and will result in months-long closures. In addition, all rail access to Vancouver was cut by the flooding, with closures expected to last days or weeks. These closures may have significant impacts on the Canadian economy, since the Port of Vancouver is the largest port in Canada, and fourth-largest in North America. Canada is one of the world’s largest grain exporters, and the flood damage will interrupt exports of wheat and vegetable oil, potentially causing a rise in global food prices, which are already at a 46-year high.
Over 10 inches of rain in 24 hours
On Monday, a large swath of southern British Columbia recorded four to 10 inches of rain in 24 hours, setting numerous records for most precipitation in a day. One of the highest 24-hour amounts observed was 11.59 inches (294.3 millimeters) in Hope, British Columbia.
The heavy rains fell on mountainous areas that, in many cases, had been denuded of vegetation by the destructive wildfires that ravaged the region in late June and early July. These wildfires had been fueled by a record heat wave that brought an insane temperature of 49.6 degrees Celsius (121°F) to Lytton, British Columbia – the hottest temperature ever recorded in Canada. A rapid-response study from the World Weather Attribution program found that this heat wave would have been “virtually impossible without human-caused climate change.” The study estimated that the event was roughly a 1-in-1000-year event in today’s climate, but added, “the observed temperatures were so extreme that they lie far outside the range of historically observed temperatures. This makes it hard to quantify with confidence how rare the event was.”
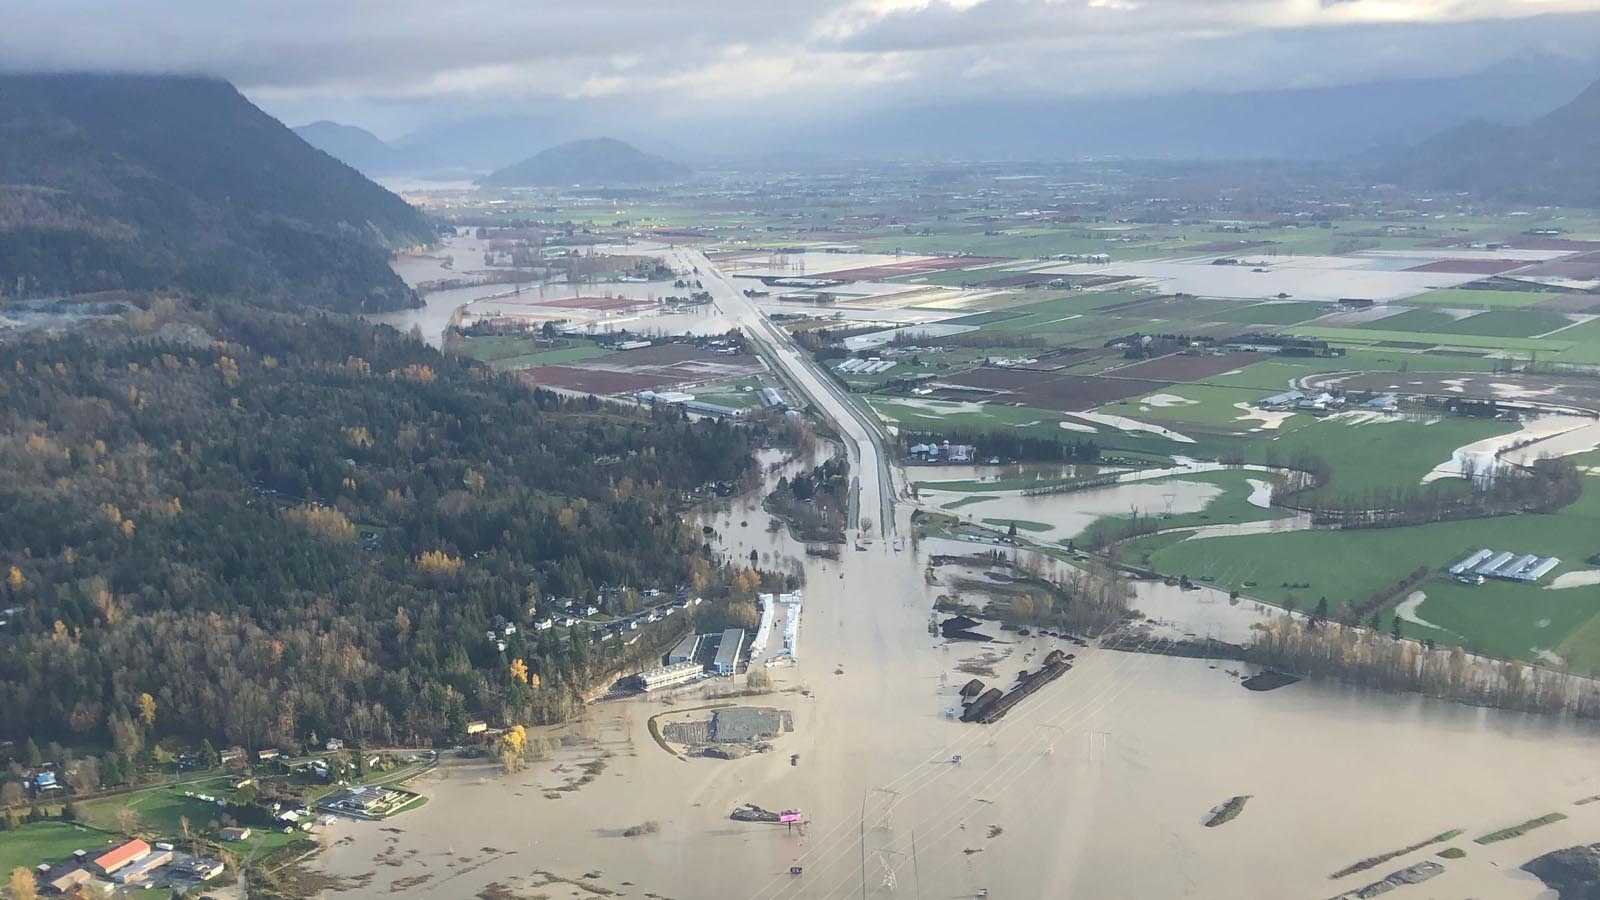
Only 140 days since we witnessed one of the most profound record-shattering heat records in observed history. Canada
In the last 24 hours, parts of British Columbia in Canada are now reporting their wettest day in recorded history after record-breaking atmospheric river. pic.twitter.com/TE9Sqab6Iy
— Scott Duncan (@ScottDuncanWX) November 15, 2021


The atmospheric river also swept into western Washington, which has been doused throughout the autumn by periods of unusually heavy rain. Rainfall from September 1 through November 15 at Seattle’s Sea-Tac International Airport was 15.87″, the most ever measured for that two-and-a-half-month period in data going back to 1945. The airport’s wettest full autumn (Sep-Nov) was in 2006, with 18.61″; that record could certainly fall before month’s end.
North of Seattle, a floodwall built in 2016 was just enough to keep the city of Mt. Vernon from major downtown flooding. Build to withstand waters on the Skagit River as high as 38 feet, the floodwall held back a crest of 36.79 feet on Monday night, the highest since a record of 37.37 feet on Nov. 25, 1990.
Atmospheric rivers: a dangerous flood threat
An atmospheric river (AR) is a band of water vapor 400-600 km wide – like a river in the sky – that acts like a pipe transporting huge amounts of water vapor out of the tropics. The amount of water that a strong atmospheric river can transport is about 7.5-15 times the discharge of the Mississippi River. When an atmospheric river moves over land, the water vapor transported can condense in the form of rain or snow, often causing extreme rainfall and flooding. In the western U.S., atmospheric river events are responsible for most of the region’s flood damages, according to a 2019 study.
In the case of this week’s atmospheric river in western North America, the moisture came from the vicinity of Hawaii, and the atmospheric river pulled moisture from ocean waters up to one degree Celsius (1.8°F) above average in temperature. Atmospheric rivers originating near Hawaii are often called “the Pineapple Express”.
Atmospheric rivers and climate change
The excellent Climate Signals website, which connects real-time extreme weather events to climate change, has this information on atmospheric rivers and climate change:
- As the climate warms, ARs are expected to form in more rapid succession and grow more intense as they become wetter, longer, and wider. There is some indication that this is already happening in association with observed Pacific Ocean warming.
- An August 2017 study spanning seven-decades of data revealed a rising trend in land-falling atmospheric rivers consistent with a long-term warming of the North Pacific, which sends more water vapor to North America. The study also identified an increase in the amount of moisture that atmospheric storms transport.
- A July 2015 study found that climate change may increase horizontal water vapor transport by up to 40 percent in the North Pacific, due mainly to increases in air moisture.
- ARs in the western US warmed substantially from 1980 to 2016. Warmer storms have important impacts on water resources, such as more precipitation falling as rain instead of snow, causing early snowmelt and flooding.
- ARs distribute heat energy from equatorial regions toward the poles. Climate change is leading to shifts in energy flows, expanding regions of stable, warm and dry air in the subtropics, which shifts atmospheric rivers poleward.
- Huang et al. 2018 found that an unusually warm AR preceded the Oroville Dam crisis and played a major role in the failure of the dam’s spillway. Runoff in the watershed supplying the Oroville dam during the peak precipitation immediately prior to the dam failure was one-third greater than it otherwise would have been, were it not for global warming.


Bob Henson contributed to this post.
Website visitors can comment on “Eye on the Storm” posts. Comments are generally open for 30 days from date posted. Sign up to receive email announcements of new postings here. Twitter: @DrJeffMasters and @bhensonweather
Source link