You might say the Oklahoma City suburb of Moore has earned the label “long-suffering” honestly. Moore was among the places in central Oklahoma devastated on May 3, 1999, by the final tornado to earn an F5 rating on the original Fujita Damage Intensity Scale or F-scale. The long-track tornado led to 41 deaths, injured more than 550 people, and caused some $1 billion in damage in 1999 dollars. The F-scale, meant to rate tornado intensity based on damage assessments, was decommissioned in 2007 and replaced with the Enhanced Fujita scale.
Moore was also ravaged on May 20, 2013, by the most recent tornado to be rated EF5 — meaning winds gusted over 200 mph — on the Enhanced Fujita scale. With top winds of 210 mph, the 2013 twister killed 26 people, destroyed more than 1,100 homes, and left an estimated $2 billion in damage (2013 USD), putting it among the most expensive tornadoes on record.
It’s now been nearly 10 years since the 2013 Moore tornado — the longest period without an F5 or EF5 in NOAA’s national database going back to 1950.
It’s looking quite possible that the record EF5 “drought” will go past the 10-year mark. Upper-level winds are predicted to be on the weak side and/or displaced from unstable surface air through at least mid-May 2023, which should keep tornado activity at a relatively low ebb. So this seems as good a time as any to explore what the strange absence of EF5s tells us, if anything.
Before we dive in, a couple of things to know about the original and enhanced Fujita scales:
- Both the old and new Fujita scales are damage-descriptive. They’re meant only to characterize the level of destruction observed. Meteorologists and engineers then infer the potential winds that caused that damage. If a violent tornado were to strike a barren desert, it would be rated EF-U (“unknown”), no matter how strong its winds were.
- F5 and EF5 ratings are considered identical in terms of damage potential. The key change in the enhanced scale was to reduce the wind speeds associated with each category because engineering studies had confirmed that weaker winds than originally thought could produce the observed damage. So F5s and EF5s are basically the same creatures, even though the F5 threshold was 261 mph and the EF5 threshold is 201 mph.

The variability of top-tier tornadoes
A total of 59 U.S. tornadoes have been rated F5 or EF5 in the 73-plus-year NOAA database. That equates to a bit less than one per year on average. However, the distribution is far from uniform. There were nine EF5 twisters from May 2007 to May 2013, and there haven’t been any since.
Before now, the longest stretch without an F5 or EF5 twister was the eight years and one day between May 3, 1999, and May 4, 2007.
The year-to-year variability goes down when EF4 tornadoes are bundled together with EF5s. There’s been only one year in modern U.S. records — 2018 — that lacked even a single F4/EF4 or F5/EF5 tornado. (The year 2018 was also the least-deadly on record, with just 10 fatalities.)
About half of tornado deaths are associated with the two top tiers, even though they represent less than 1% of all U.S. tornadoes.
The variability drops even more when you open the lens wider and look at all tornadoes classified as “intense”: that is, EF3, EF4, or EF5. Figure 2 below shows that most years since 1990 have ginned up anywhere from about 25 to 50 tornadoes at these three top levels. The number of all tornadoes rated at least EF0 roughly doubled from the 1950s to the 1990s, with the advent of Doppler radar and the growth of storm spotting and chasing; it has since stabilized in a range between about 900 and 1800 per year.
There’s no major trend evident in the number of intense or violent tornadoes, although the last decade has run a touch below the longer-term average.
| Year | All tornadoes (F/EF0 > F/EF5) | Intense tornadoes (F/EF3 > F/EF5) | Violent tornadoes (F/EF4 > F/EF5) | F/EF5 tornadoes |
| 1990 | 1133 | 53 | 15 | 3 |
| 1991 | 1132 | 46 | 7 | 1 |
| 1992 | 1313 | 58 | 14 | 1 |
| 1993 | 1173 | 36 | 6 | 0 |
| 1994 | 1082 | 35 | 5 | 0 |
| 1995 | 1235 | 31 | 11 | 0 |
| 1996 | 1173 | 23 | 3 | 1 |
| 1997 | 1148 | 39 | 10 | 1 |
| 1998 | 1424 | 43 | 8 | 2 |
| 1999 | 1339 | 64 | 13 | 1 |
| 2000 | 1075 | 23 | 3 | 0 |
| 2001 | 1215 | 29 | 6 | 0 |
| 2002 | 934 | 31 | 5 | 0 |
| 2003 | 1374 | 35 | 8 | 0 |
| 2004 | 1817 | 28 | 5 | 0 |
| 2005 | 1265 | 21 | 1 | 0 |
| 2006 | 1103 | 32 | 2 | 0 |
| 2007 | 1096 | 32 | 5 | 1 |
| 2008 | 1692 | 59 | 10 | 1 |
| 2009 | 1159 | 22 | 2 | 0 |
| 2010 | 1282 | 45 | 13 | 0 |
| 2011 | 1705 | 85 | 23 | 6 |
| 2012 | 939 | 30 | 4 | 0 |
| 2013 | 916 | 28 | 9 | 1 |
| 2014 | 929 | 27 | 7 | 0 |
| 2015 | 1178 | 21 | 3 | 0 |
| 2016 | 974 | 28 | 2 | 0 |
| 2017 | 1418 | 15 | 2 | 0 |
| 2018 | 1121 | 12 | 0 | 0 |
| 2019 | 1529 | 36 | 3 | 0 |
| 2020 | 1086 | 24 | 6 | 0 |
| 2021 | 1313 | 24 | 3 | 0 |
| Average (1990-2021) |
1227 | 35 | 6.7 | 0.6 |
How does climate change affect tornadoes?
Early research into the effect of climate change on tornadoes hypothesized that instability fueled by warm, humid surface air would increase but that tornado counts might drop if weakening north-to-south temperature contrasts were to decrease the vertical wind shear needed for tornadic thunderstorms.
More recent studies — which can now simulate thunderstorms more directly by nesting higher-resolution regional weather models within coarser global climate models — have tended to put a different spin on the matter. Even if most days on average see fewer tornadoes, the outbreaks that do occur on days with sufficient wind shear might actually spawn more twisters than before. This view syncs with climatological work finding that tornadoes are already clumped into fewer but more active periods and seasons, with long quiet stretches in between.
Read: Climate change and tornadoes: Any connection?
Increased variability is a hallmark of other weather phenomena in a human-warmed climate, especially the well-established phenomenon of intense rainstorms getting even heavier.
One might even draw a rough parallel between the EF5 drought and a record-long pause in major U.S. hurricane landfalls. After Hurricane Wilma struck Florida in October 2005, the contiguous United States went more than 11 years without any strikes from a major hurricane (Category 3, 4, or 5). During most of this time, the Atlantic was bristling with major storms; they just weren’t moving onto the Gulf or Atlantic coasts, as prevailing winds were keeping them out to sea.
Eventually, the record-long stretch in major U.S. landfalls got so much notice that scientists began looking into it. One 2015 study concluded that the major-landfall “drought” was “a matter of luck” and that it was unlikely that some type of protective climate shift had occurred.
Sure enough, the tide soon turned, and in a devastating way. From 2017 through 2022, seven major landfalls raked the nation’s Gulf and Atlantic shores — Harvey, Irma, Michael, Laura, Zeta, Ida, and Ian — plus Maria in Puerto Rico.
When it comes to tornado damage, looks can deceive
Although high-resolution Doppler radar now probes the inner workings of tornadic storms with more detail than ever before, EF ratings are still based solely on painstaking, firsthand storm surveys carried out by experts at ground level.
The Enhanced Fujita scale made these surveys far more systematic. The scale includes 28 “damage indicators,” which range from motels and one- or two-family residences to transmission-line towers and hardwood or softwood trees.
In a storm survey, each damage indicator is assigned a degree-of-damage value, typically along a range from “threshold of visible damage” to “total destruction.” These assignments, each of which corresponds to an estimated wind speed, can get an upward or downward adjustment based on how well a structure was built.

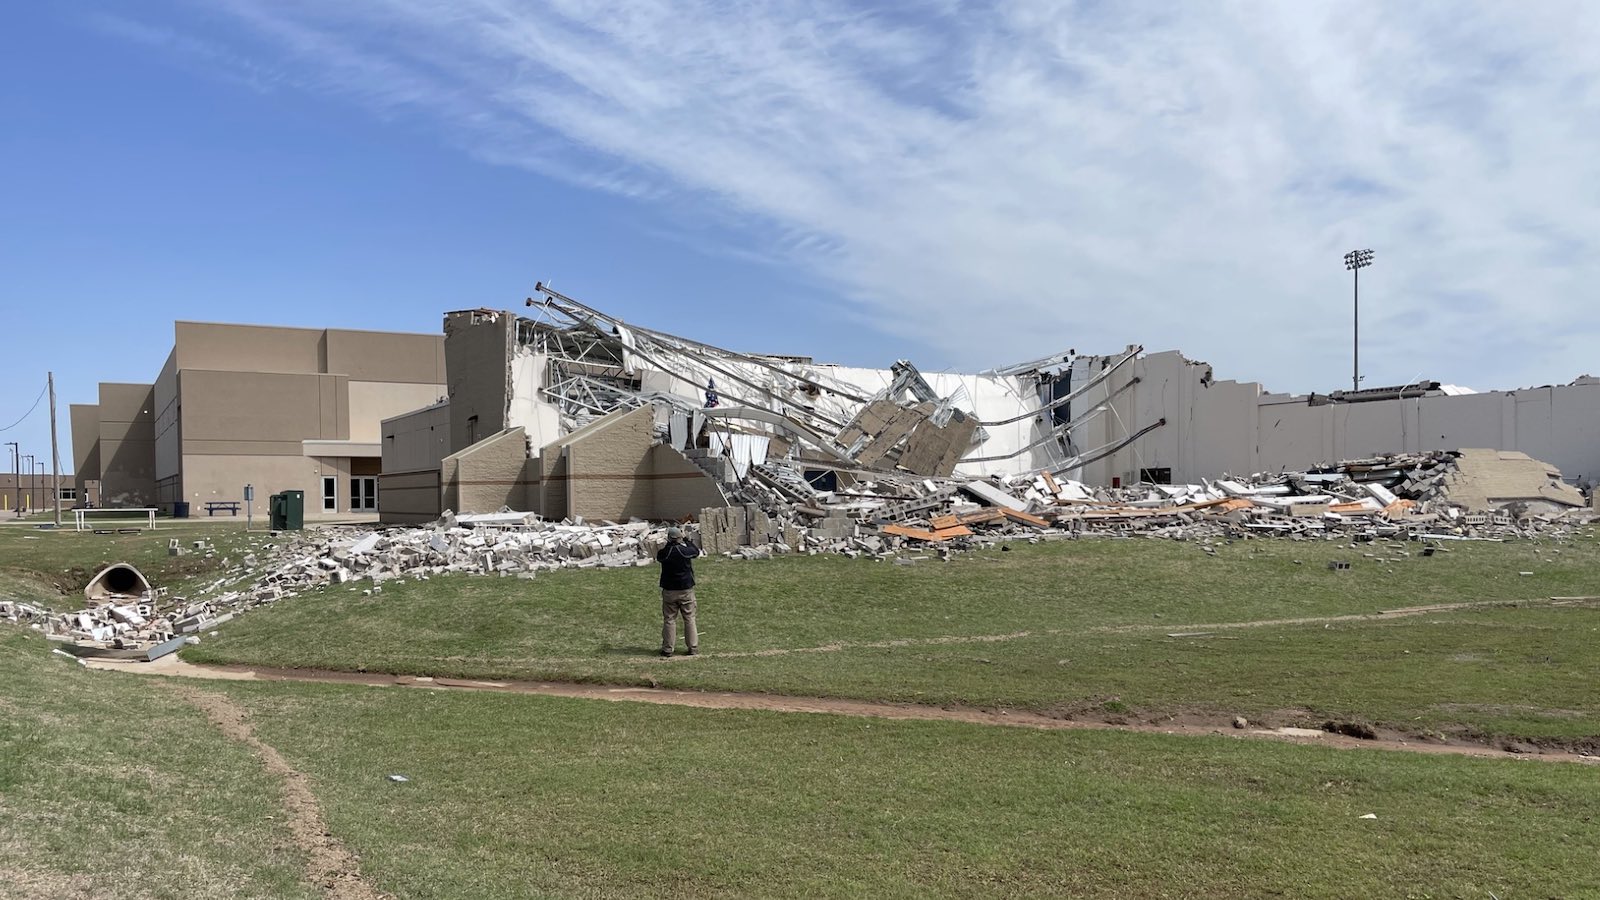
On April 19, 2023, central Oklahoma was hammered with slow-moving tornadic storms. One large tornado moved through western parts of Shawnee (pop. 30,000), inflicting widespread damage on highly visible targets that included a high-school gym and a shopping center.
The circulation of the Shawnee tornado was a beast on radar — huge and ominous. Surveys confirmed that the twister’s damage extended across a swath as wide as 2,300 meters (about 1.3 miles). But to the surprise of some observers, this tornado was rated “only” a high-end EF2, with top winds estimated at 130-135 mph.
In Shawnee, James LaDue — acting director of the National Windstorm Impact Reduction Program at the National Institute of Standards and Technology, or NIST — was part of the team that canvassed the tornado’s impact. LaDue and his survey colleagues saw ample evidence of weak construction that allowed winds estimated at well under EF5 strength to produce harrowing outcomes.
The sheer size of the tornadic circulation on radar may have helped fuel initial speculation that the Shawnee twister was intense or even violent. Yet some of the largest tornadoes on record have failed to produce EF5 damage. One twister that carved a two- to three-mile-wide damage path near Edmonson, Texas, on May 31, 1968, earned only an EF3 rating.
Conversely, a tornado that struck Oakfield, Wisconsin, on July 18, 1996, yielded F5 damage even though its width was rated at only 400 yards, or just under one-quarter of a mile.

Toward more accurate tornado ratings
LaDue is chair and co-founder of a committee working to standardize wind speed estimation for tornadoes, a project launched in 2014 by the American Society of Civil Engineers (ASCE)/Structural Engineering Institute (SEI) and the American Meteorological Society (AMS). The project includes revisions to the Enhanced Fujita scale.
After nearly a decade, the joint ASCI/SE/AMS effort still has years to go. Its exhaustive work, already involving more than 80 scientists and engineers and thousands of hours, will continue until the new standard, Wind Speed Estimation in Tornadoes — is released, most likely late in the 2020s.
There’s been keen interest for years in somehow incorporating remotely observed data, especially from mobile Doppler radar, to supplement on-the-ground damage indicators. One infamous case was the El Reno, Oklahoma, tornado of May 31, 2013, that killed veteran storm chaser Tim Samaras and several others. Radar data from Doppler on Wheels units showed winds reaching 257 mph at about 375 feet above the surface. This might have corresponded to surface gusts in the EF5 range. Yet if such winds did reach the ground, it was in open country where no damage indicator could be found to confirm them.
Such brief but incredibly powerful near-surface winds may be more common than long predicted by theory, computer models, and lab experiments, according to a paper published in February by longtime Doppler on Wheels scientists Karen Kosiba and Joshua Wurman. In hurricane eyewalls, winds tend to be strongest a few hundred meters above ground level. However, Kosiba and Wurman found in nine tornadoes sampled at very low altitudes that the winds were roughly 30% stronger just 15 meters above ground level (about 50 feet) than they were at 100 to 140 meters (about 330 to 460 feet).
The radar data suggest that such extreme gusts typically last for much less than a second. In contrast, the Enhanced Fujita scale assumes three-second gusts over open terrain at the standard height for wind measurement (10 meters, or 33 feet).
For this and other reasons — including the apples-to-oranges issue that would arise if future tornadoes were rated based on radar technology that didn’t exist before the 1990s — the Enhanced Fujita scale will continue to rely solely on ground-based damage surveys, according to Tanya Brown-Giammanco, director of Disaster & Failure Studies at NIST and chair of the EF-scale subcommittee for the ASCE standard.
However, the new standard will allow for radar data, treefall patterns, and other evidence to be used in addition to the Enhanced Fujita scale in more general estimates of tornadic wind speed.
As for the ongoing EF5 “drought,” it could be the result of a mix of factors, Brown-Giammanco said. Some EF4 tornadoes aren’t far from the EF5 threshold, such as the high-end EF4 tornado that ravaged Rolling Fork, Mississippi, on March 24, killing 17 people with top winds estimated at 190 mph. “The EF-Scale absolutely has subjectivity and expert judgment involved,” Brown-Giammanco points out.
On the other end of the spectrum, as in the El Reno case, “it’s very difficult to come up with a rating where there’s not much damaged.” The upcoming standard will include several new damage indicators intended to help better rate tornadoes in rural areas, including center-pivot irrigation systems, wind turbines, and farm silos and grain bins. Other new indicators will include churches and passenger vehicles.
Another challenge: less than half of the 28 damage indicators can be used to determine an EF5 rating, as the others are totally destroyed at EF4 or weaker winds. “There are very few possibilities to get an EF5 rating other than from houses, where the slab must be swept clean and it must be a ‘well-constructed’ house,” says Brown-Giammanco. “Many houses in our country are missing some key features that make them ‘well-constructed’ for wind resistance.”
Then there’s plain old natural variability to consider. “It’s also possible there just haven’t been any tornadoes that were truly of EF5 strength. There are lots of possibilities that could affect the count, and all of these possibilities may have had some contribution.”
While top-end tornadoes will always be highly variable, climate science is telling us at least some things about future twister behavior. There are hints — not yet statistically significant, but consistent with a warmer climate — that tornado outbreaks are striking farther north during the winter months. The hallmark example of recent years is the catastrophic outbreak of Dec. 10, 2021, in and near western Kentucky, and the swarm of more than 100 tornadoes (a record for any December day) that pinwheeled across the Midwest as far north as Wisconsin just five days later, on December 15.
Going forward: More than EF5s to worry about
There’s also been a measurable increase in tornado activity over and near the highly vulnerable Mississippi Valley, a worrisome shift that climate-model studies have shown may continue. The disastrous Rolling Fork twister struck in the very heart of this evolving Tornado Alley 2.0.
Moreover, just as with a Category 5 hurricane, only a tiny part of the area affected by an EF incurs top-level damage. A much larger area gets lesser yet still-devastating impacts. It’s the entire tornado or hurricane that truly matters. And it’s the variability of when and where the worst tornadoes strike — something that may only increase as climate change unfolds — that ought to keep Americans twister-aware.
Jeff Masters contributed to this post.
Website visitors can comment on “Eye on the Storm” posts (see comments policy below). Sign up to receive notices of new postings here.
Source link