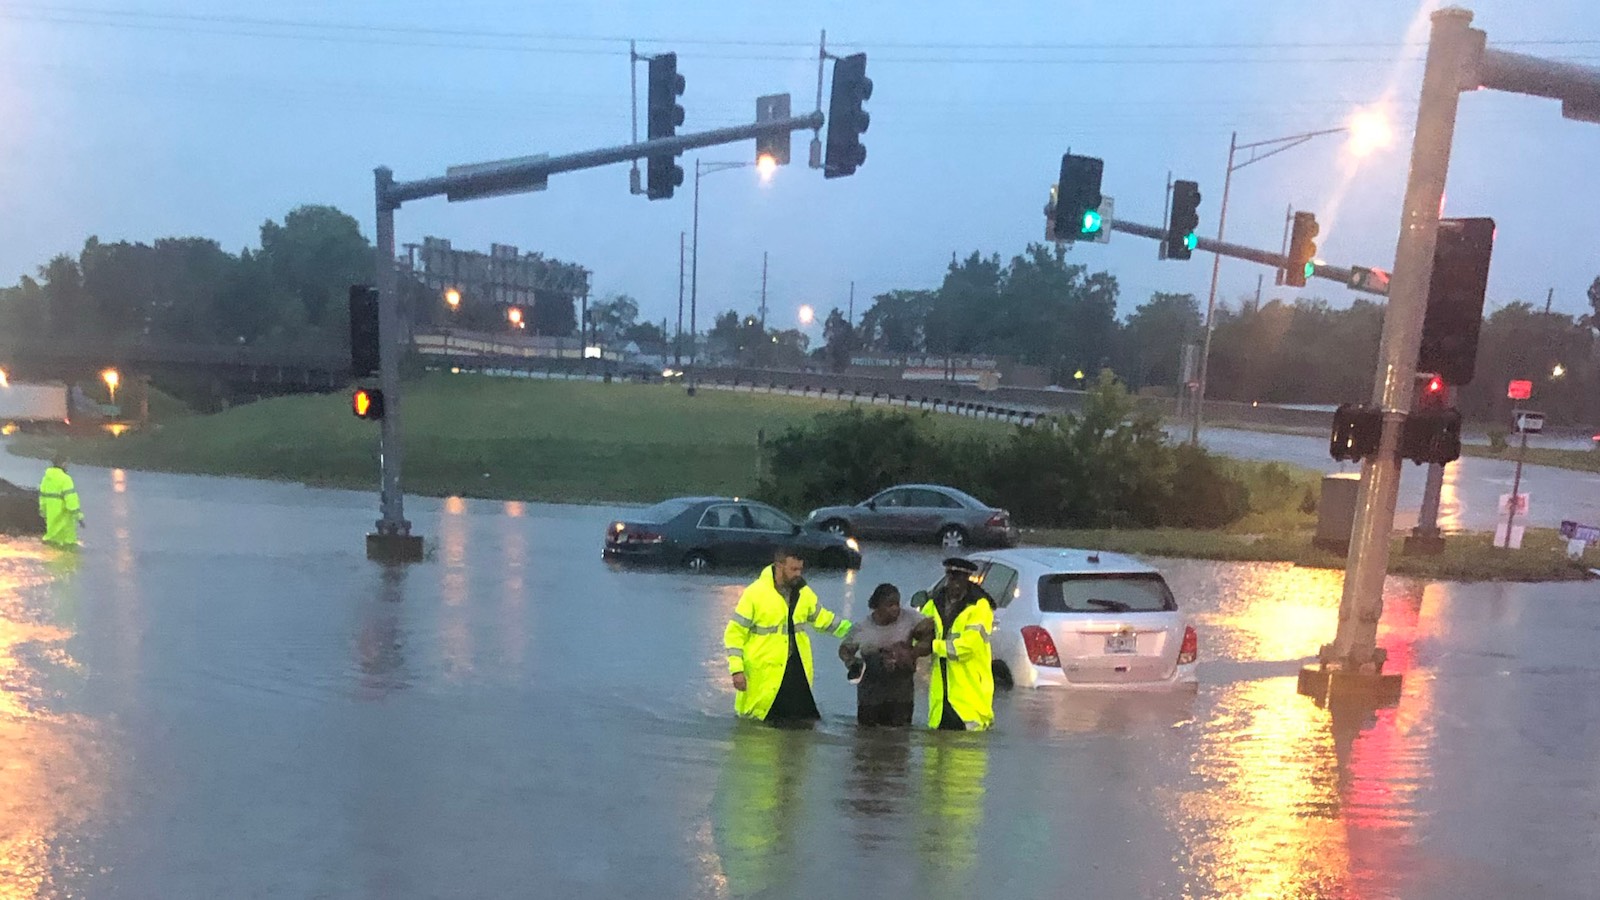
Torrents of rain that began before dawn on Tuesday, July 26, gave St. Louis, Missouri, its highest calendar-day total since records began in 1873. And the deadly event is just the latest example of a well-established trend of intensifying downpours in many places across the globe.
The official reporting site at Lambert International Airport received 8.6 inches of rain from midnight to 11 a.m. Central Standard Time. (Standard time is used year-round to separate calendar days for meteorological data purposes.) Another 0.46 inch was recorded just before midnight CST, bringing the total for July 25-26 to 9.04 inches as of 11 a.m. CST.
The predawn onset of the storms meant that many residents were startled awake by floodwaters or caught on highways during early commutes. Dozens of water rescues were carried out across the area. The storm closed Interstate 70 and many other key roads across the St. Louis area throughout the morning, according to the St. Louis Post-Dispatch. At least one death has been reported as of Tuesday evening, a person pulled from an inundated vehicle.
More heavy rain is possible early Wednesday, although the storms in that round are expected to keep moving rather than stalling out.
Below are several records set in Tuesday’s brief but intense deluge. We’ll update this information after final data for Tuesday are in.
- Heaviest rainfall in a 24-hour period, including periods that straddle calendar days: at least 9.04 inches (old record 7.02 inches on August 19-20, 1915, from the remnants of the 1915 Galveston hurricane)
- Heaviest calendar-day rainfall: at least 8.60 inches (old record 6.85 inches on August 20, 1915).
- Second-heaviest total for two calendar days: at least 9.04 inches (old record 9.54 inches on May 16-17, 1995)
The culprit behind the early-morning deluge was a mesoscale convective system — a large, highly organized complex of showers and thunderstorms — that moved in a “training” fashion from west-northwest to east-southeast across the area. The system included one band of intense rainfall passing directly over St. Louis, with a secondary band roughly 60-70 miles to the north. Some areas just northwest of St. Louis may have seen as much as 14 inches of rain.
The Midwest is getting more rain — and more extreme rain events
Although the Midwest climate is naturally drought-prone, recent decades have trended more toward the wet side of the spectrum. “Annual precipitation in the Midwest has increased by 5% to 15% from the first half of the last century (1901–1960) compared to present day (1986–2015),” the Fourth National Climate Assessment observed in 2018.
There’s a well-established trend in many parts of the globe for the heaviest short-term rainfall events to become more intense, consistent with a human-warmed atmosphere allowing more moisture to evaporate from warmer oceans and to flow into rainmaking systems. Over the past century, the Midwest has seen a 42% increase in the amount of rain falling in top-end short-term rainfall events (the heaviest 1% of events). That was larger than any other region of the country for the period 1901-2016, although it was slightly surpassed by the Northeast in the period 1958-2016 (see tweet below, which includes a National Assessment analysis).
Read: Why is it raining so hard? Global warming is delivering heavier downpours
“Storm water management systems and other critical infrastructure in the Midwest are already experiencing impacts from changing precipitation patterns and elevated flood risks,” the National Climate Assessment, a sweeping government report on the impacts of climate change in the United States, noted in 2018.
As one of the 10 biggest U.S. cities between 1850 and1960 — but only the 70th-largest as of 2020 — St. Louis joins other venerable but now-smaller U.S. cities in having to adapt major century-old infrastructure to the evolving climate of the 21st century. As noted in the National Climate Assessment, the Metropolitan Sewer District in St. Louis had embarked upon a $100 million “rainscaping” project designed to divert storm water runoff in the northern portion of the city of St. Louis and adjacent north St. Louis County, including areas where the July 26 storm tracked.
Significant flood threat for Kentucky and West Virginia this week
The stalled frontal boundary that brought St. Louis its record flooding will be draped over the Ohio River Valley through Friday, bringing an elevated threat of flash flooding across portions of Kentucky and West Virginia. On Tuesday evening, this area was been placed under a moderate-risk threat of excessive rain leading to flash flooding. The threat extended across a 48-hour period from Wednesday through Friday morning by the National Weather Service, which is predicting widespread rainfall amounts of 2-4 inches on Wednesday and 1-3 inches on Thursday. This area has already seen significant flash flooding during the past few weeks from extreme rainfall; however, soil moisture levels are currently near average.
As detailed in the tweets below by Alex Lamers, this region, which is highly mountainous, is particularly prone to deadly flash floods.
Website visitors can comment on “Eye on the Storm” posts. Please read our Comments Policy prior to posting. Comments are generally open for 30 days from date posted. Sign up to receive email announcements of new postings here. Twitter: @DrJeffMasters and @bhensonweather


