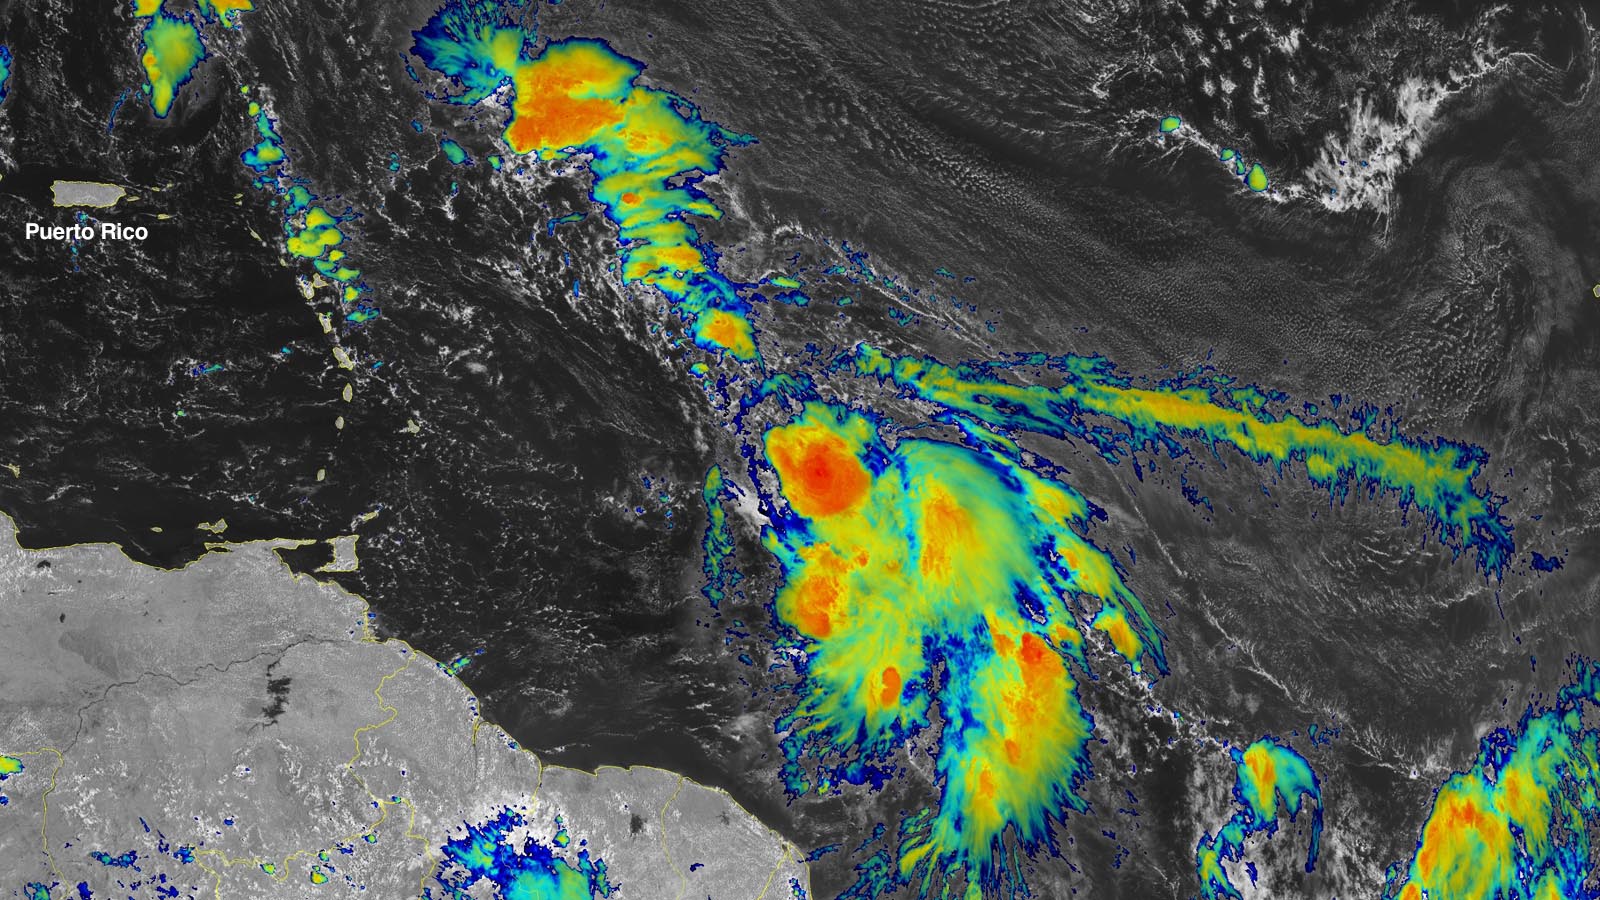
A tropical wave designated Invest 94L was located about 800 miles east of the Lesser Antilles islands on Wednesday afternoon, and was headed west to west-northwest at about 15 mph. This wave is expected to spread heavy rains and strong, gusty winds into the Lesser Antilles on Friday and Saturday, and is likely to become at least a tropical depression by Thursday.
Satellite images on Wednesday afternoon showed that 94L had a modest amount of heavy thunderstorms, and was close to developing a well-defined surface circulation. Conditions will be favorable for development of the disturbance over the next three days, with moderate wind shear of 10-15 knots, a moist atmosphere, and exceptionally warm waters of 29-30 degrees Celsius (84-86°F), about 1-2 degree Celsius (1.8-3.6°F) above average.

In its 8 a.m. EDT Wednesday Tropical Weather Outlook, the National Hurricane Center gave 94L two- and seven-day development odds of 80%, and mentioned that watches and warnings might be needed for portions of the Lesser Antilles later on Wednesday. The system has plenty of support for development from the models, though they disagree on how quickly 94L might intensify. The models generally agree that a stronger storm is likely to turn to the northwest and then north, out to sea, before reaching the Lesser Antilles; a weaker storm is more likely to track farther west, potentially passing over or near the northern Leeward Islands on Friday or Saturday. In both cases, an intensifying eastern U.S. upper low is expected to force the system to recurve northward into the open Atlantic before it can reach Puerto Rico or the Virgin Islands (and long before it would pose any potential threat to the U.S. East Coast). The next name on the Atlantic list is Tammy. The first hurricane hunter mission into 94L is scheduled for Thursday morning.

Norma quickly strengthens as it moves toward Mexico’s Baja Peninsula
Tropical Storm Norma was intensifying at a brisk pace on Wednesday, taking a course that will likely bring it over or near the southern tip of Mexico’s Baja Peninsula by late this weekend. As of 11 a.m. EDT Wednesday, Norma had top sustained winds of 70 mph and a central pressure of 991 millibars. Norma’s top winds have increased 30 mph in just 18 hours, and Norma will almost certainly end up meeting the official definition of rapid intensification (35 mph in 24 hours). Norma was positioned nearly 600 miles south-southeast of Cabo San Lucas, Mexico, moving north-northwest at 7 mph.
By Wednesday morning, Norma had already built a large core of intense showers and thunderstorms (convection) with extensive banding. Strong outflow at the top of Norma was being assisted by a powerful jet stream just to the north, with an arc of cirrus extending all the way to the Gulf of Mexico. Norma’s solid structure will help it continue to gain strength quickly. The mid-level environment around the core of Norma is very moist (relative humidity 75-80%), and Norma will continue to traverse very warm waters for the next several days, with sea surface temperatures of 29-30 degrees Celsius (84-86°F). Wind shear will be increasing by late week as Norma moves farther north, allowing dry air to wrap into the storm, so Norma’s burst of strengthening will likely peak on Thursday or Friday.
The SHIPS rapid intensification index from 12Z Wednesday gave Norma a 41% chance of gaining an additional 40 knots (45 mph) of sustained wind, which would bring it to 115 mph and make Norma a major hurricane (category 3). The state-of-the-art HAFS-A and HAFS-B intensity models concur in bringing Norma to a peak strength in the Cat-3 range, as predicted by the National Hurricane Center.

The Tuesday-night operational runs from the leading long-range track models diverge as soon as Thursday, and by Sunday the three top models differ by literally 180 degrees on Norma’s track (see Figure 3 above): the GFS model takes Norma northeastward to near Cabo San Lucas, the European turns Norma on its heel toward the south, and the UKMET angles Norma southwestward out to sea. These stark differences arise mainly from how strong Norma is in each model. The European and UKMET models keep Norma as a tropical storm – an implausible outcome given the ongoing rapid intensification. A track toward the southernmost Baja Peninsula appears more likely, as projected by the GFS and predicted by the National Hurricane Center. In fact, the European ensemble runs includes a few members with a more GFS-like track, and those members tend to be notably stronger with Norma.
It’s possible dry air and wind shear will weaken Norma substantially by the time it nears southernmost Baja Peninsula. However, Norma may also slow down as nears the coast, and this would hike the risk of torrential rains and flash flooding over the weekend, particularly on east-facing slopes of the southern Baja Peninsula.

Time to watch the North Indian Ocean
The North Indian Ocean has two tropical cyclone seasons — one centered in May, before the onset of the monsoon, and one centered in October/November after the monsoon has waned. During the June-September peak of the monsoon, tropical cyclones are uncommon due to interference from the monsoon circulation.
Recent forecasts from both the European and GFS models continue to predict that tropical cyclones could form late this week in both the Bay of Bengal (to the east of India) and the Arabian Sea (to the west of India), and interests in the North Indian Ocean should be carefully monitoring tropical cyclone outlooks over the coming days. The threat is greatest in the Arabian Sea, where sea surface temperatures have been boosted in the Arabian Sea by about 1 degree Celsius (1.8°F) because of an unusually strong positive mode of the Indian Ocean Dipole.
The Indian Ocean Dipole is an irregular natural oscillation of sea surface temperatures in which the western Indian Ocean becomes alternately warmer and then colder than the eastern part of the ocean. A positive Indian Ocean Dipole brings warmer-than-average sea surface temperatures to the Arabian Sea and cooler-than-average temperatures near Indonesia.
Website visitors can comment on “Eye on the Storm” posts (see comments policy below). Sign up to receive notices of new postings here.
Source link