In homes with old windows and insufficient insulation, heat seeps through walls and ceilings.
So a Canadian company called MyHEAT is helping people visualize that invisible heat loss.
The team mounted a sensor to a small airplane that flies back and forth over an entire city, measuring the thermal energy emitted by buildings.
“This highly specialized sensor will do a flight path back and forth across a city … A pretty major sized city, we can collect over two to four nights,” says co-founder Ian Maddock.
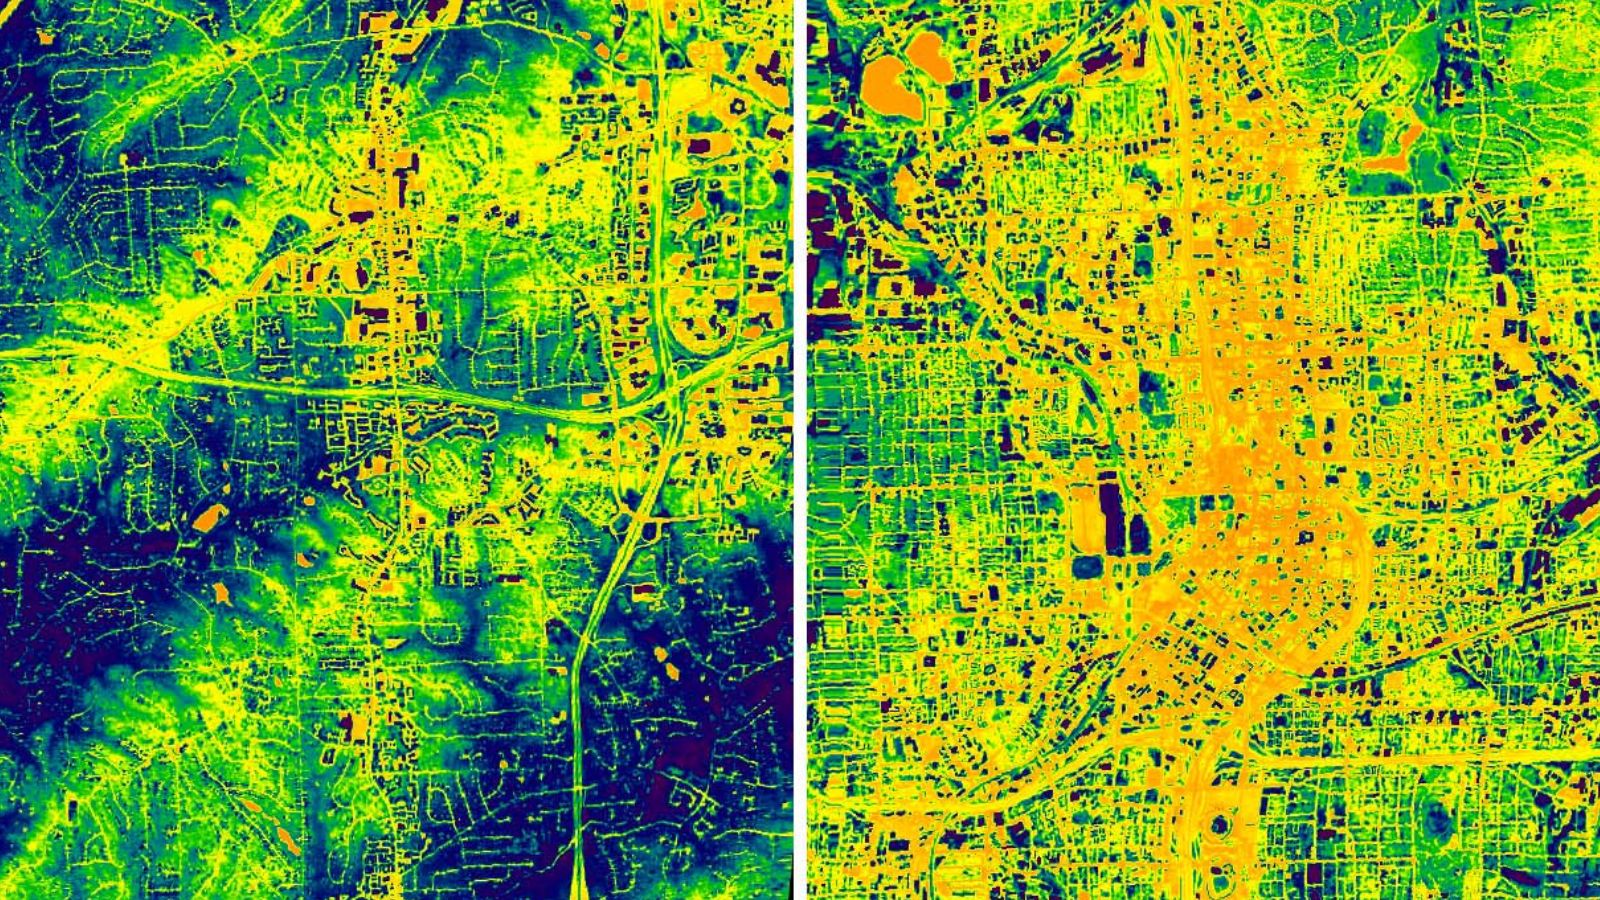
He says the thermal data is converted into bird’s-eye images. On each building, the areas with the least heat loss are shown in blue, and those with the most, in red.
“Homeowners will see that and they’ll go, ‘Oh, you know, that’s where we have our old windows in our living room,’” Maddock says. “And if you think about the rooftop view of this home … if you have a poorly insulated cavity wall, you’re going to see a band of red across the side of the home.”
Each house is rated on a scale from one to 10 for how its heat loss compares to nearby homes.
Maddock says utilities are using the maps to identify and reach out to homeowners who could benefit most from energy efficiency programs.
He says when homeowners actually see how their home is losing heat, it helps make a compelling case for investing in upgrades that can save energy and money.
Reporting credit: Sarah Kennedy/ChavoBart Digital Media
Source link