It’s a universal fear — getting an F in a class or a paper. But what happens when an entire region fails?
Take the Imperial Valley, which frequently receives low or failing grades for air quality. This agricultural hub in Southern California — ranked as one of the state’s poorest counties — is plagued by air pollution from agricultural burns, desert dust, wildfire smoke, and even pollution from the ongoing evaporation of the Salton Sea.
In response, community groups began working in 2007 to develop and implement the Identifying Violations Affecting Neighborhoods, or IVAN, network, an environmental monitoring system that allows residents to report environmental violations and sign up for air quality alerts. Air quality monitors are key to the program. Dozens scattered around the region provide the community with publicly accessible air pollution readings.
Climate change is contributing to degraded air quality
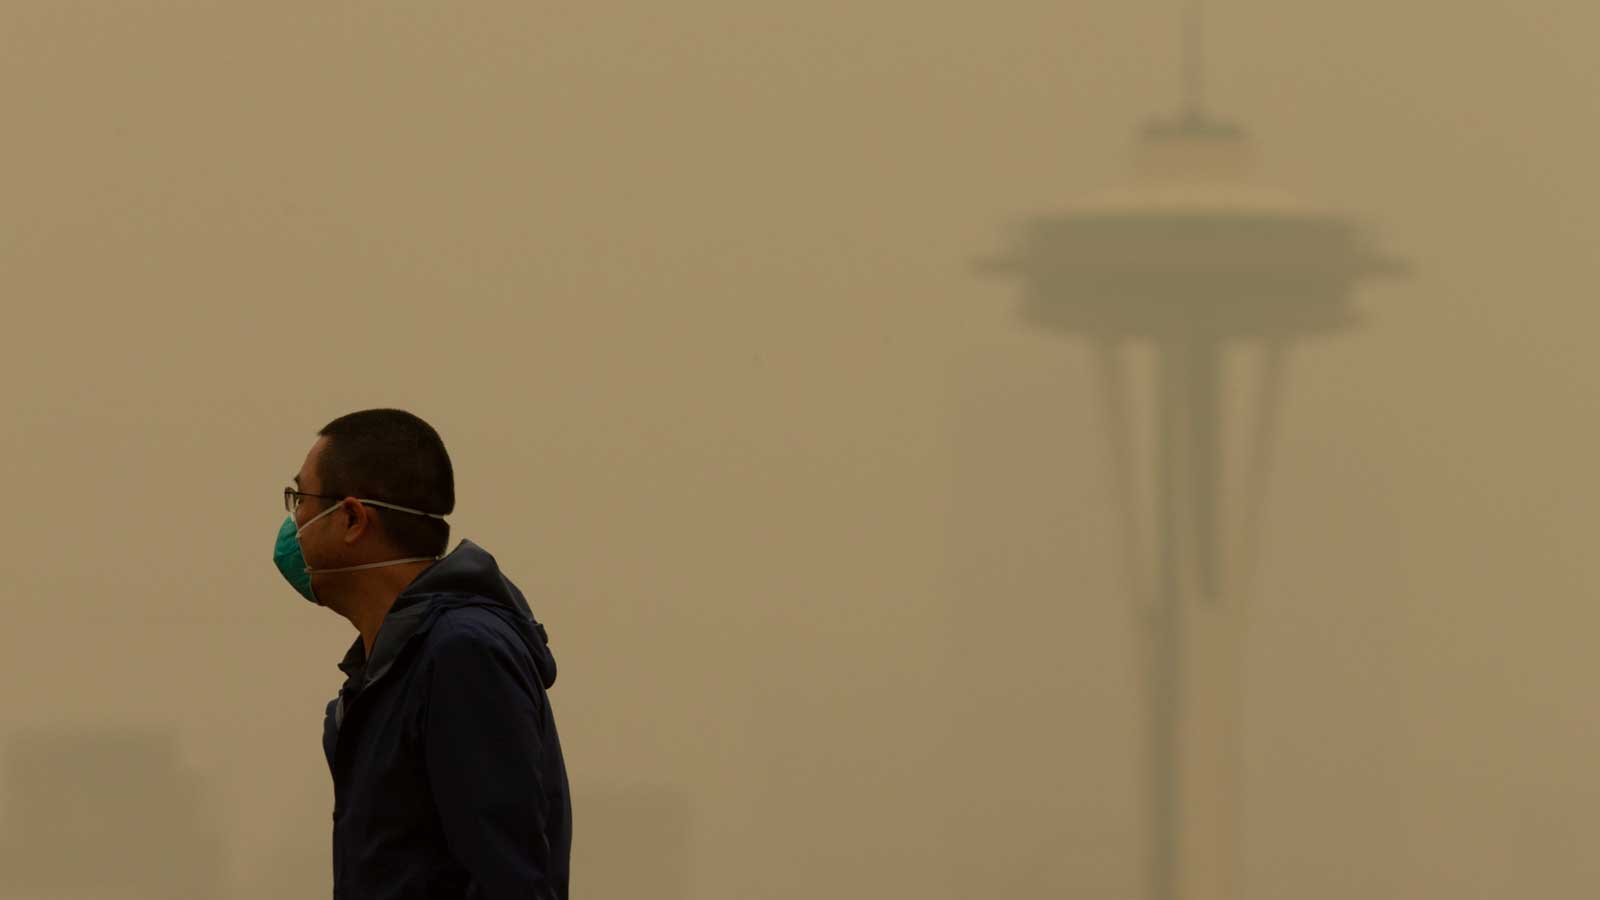
Across the country, such air monitoring projects are growing in popularity as climate change increases the frequency and intensity of wildfires, which send plumes of dangerous smoke into the air. Heat waves can also worsen air pollution by contributing to the formation of smog. When monitors detect poor air quality, people can receive alerts and protect their health by closing doors and windows and avoiding time outdoors without a mask.
Federal and state-run air quality monitors provide some information about air quality levels. But they aren’t always ubiquitous enough to inform communities of air quality risks. And high-quality government-level air quality monitors may be too expensive for communities looking for hyper-localized air quality data, such as at the playground of a school.
So communities are increasingly turning to affordable and easily accessible air quality monitors. These devices allow communities to establish their monitoring networks, providing hyper-localized data that can fill the gaps in federal and state monitoring efforts.
“Community air monitoring allows communities to play an active role in identifying, assessing, and understanding the levels of various pollutants in their air,” said Amber Eglund, an environmental protection specialist at the Colorado Department of Public Health and Environment. “It raises awareness of potential health risks and empowers communities to make informed decisions about their health, advocate for policy change and cleaner technologies, and foster an overall healthier environment.”
In 2022, a funding call from the U.S. Environmental Protection Agency led to over $53 million for community organizations and local governments to address air quality monitoring disparities and improve community education on environmental hazards.
In California, the IVAN network has expanded to six other communities across the state. The Colorado Department of Public Health and Environment has added a new team to its Air Pollution Control Division to focus on community monitoring. And in the Methow Valley in Washington, Clean Air Methow is working with the University of Washington to identify “clean air ambassadors” to encourage people who already have monitors to make their data publicly accessible.
Air monitoring at schools
Many of the new monitors are going in at schools.
Children and teens are particularly vulnerable to the impacts of poor air quality. And ample research shows that children exposed to poor air quality are significantly more likely to experience asthma and other respiratory illnesses than their peers living in areas with better air.
In Yakima County, where neighborhoods were profoundly affected by wildfire smoke in the summer of 2023, high schoolers worked with University of Washington researchers to set up air quality monitors in schools and create a curriculum on local environmental issues and public health.
But significant gaps remain. Low-cost monitors are not always deployed equally across communities of various income levels and demographics. Coverage of one popular brand of inexpensive air sensors tends to be higher in predominantly White communities even though predominantly Black and Brown communities face significantly higher levels of pollution.
Though children are particularly vulnerable to poor air quality, other populations would also likely benefit from improved air quality data and local response plans. Outdoor workers, like those working on agricultural sites in the Imperial Valley, also face heightened health risks. But given data gaps in many agricultural areas, it is difficult for these workers to receive adequate protections when air quality is dangerously poor.
Where to find information about your air quality


The Air Quality Index, or AQI, provides easily understandable information about air quality levels and corresponding health recommendations ranging from “Good” to “Hazardous.” It is available on most weather apps and at airnow.gov.
Savannah D’Evelyn is an environmental health scientist and bio-social scientist at the University of Washington and Rachel Goldstein is a Research and Modeling Manager at Energy Innovation Policy and Technology LLC®, a Yale Climate Connections content-sharing partner.
We help millions of people understand climate change and what to do about it. Help us reach even more people like you.
Source link


