Non-tropical winter storms can lash the U.S. East Coast just as destructively as a major hurricane might. Sixty years ago this weekend, coastal areas from North Carolina to New Jersey took the brunt of a prolonged, intense nor’easter that set the regional standard for coastal damage from winter storms.
A look at what happened in the Ash Wednesday storm, which peaked on March 6, 1962, is illuminating in its own right. And when you factor in 8 to 12 inches of subsequent sea level rise along the Mid-Atlantic coast, a similar storm happening today would be even more impressive, muscling out several recent hurricanes.
Now is a good time for such a look-back, and it’s not a bad time to look ahead as well. NOAA has just updated its near- and long-term projections for sea level rise along the U.S. coast. The new report only confirms that the Mid-Atlantic is set to see some of the biggest rises relative to other parts of the nation and world between now and 2050.

An unexpected, complex, unusual, and devastating storm
Part of what made the Ash Wednesday storm so destructive was rotten timing. Two factors that independently boost tides every 28 days – the moon’s closest approach to Earth, or perigee, and the new moon, or syzygy – were separated by only 31 minutes as the Ash Wednesday storm peaked on March 6, 1962.
The storm’s meteorological setup was close to a worst case for high Mid-Atlantic water, and it was not well predicted. An upper low stalled over the Southeast U.S., with an upper ridge over the Northeast. The surface reflection of this pattern, a southwest-to-northeast elongated surface low, held in place for the better part of two days, driving easterly winds and water toward the Mid-Atlantic coast along a fetch of more than 600 miles. The storm was nicknamed the Five High Storm because it generated five unusually high tides in a row at many locations from March 5 to 7.
Farther inland, heavy snow slammed the suburbs just west of Washington, D.C., with extreme amounts in the Shenandoah Valley. Big Meadows, Virginia, reported a storm total of 42 inches, a state record for snowfall at the time.
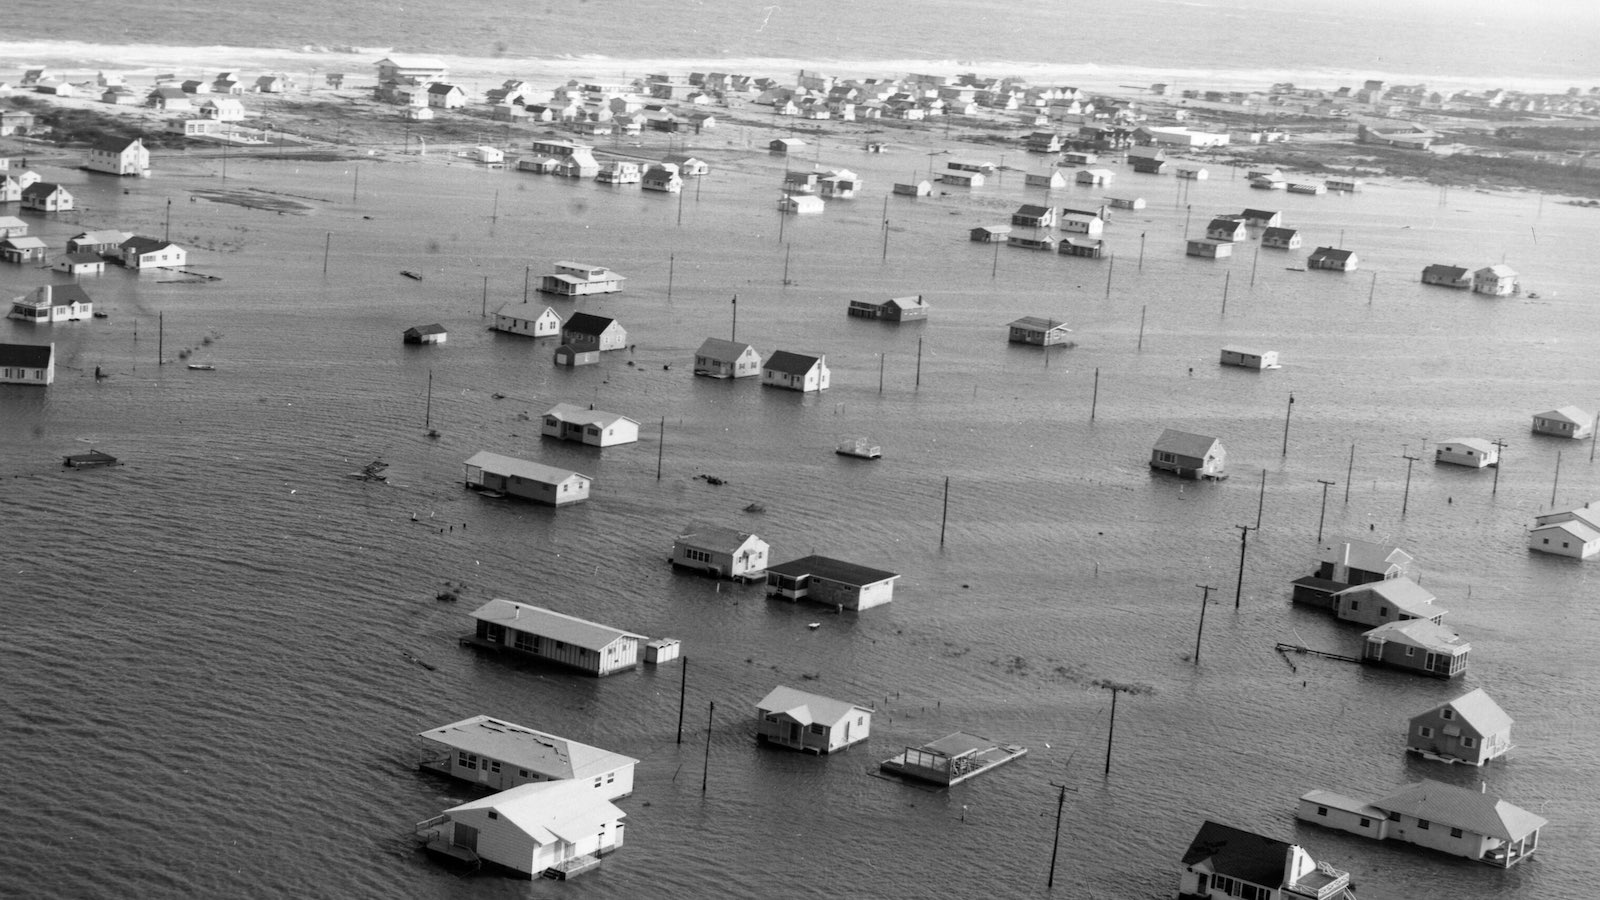
Even with far less coastal development along the Mid-Atlantic in 1962 than today, the Ash Wednesday storm produced major destruction. Close to 1,800 homes were destroyed, and more than 16,000 were damaged. Massive waves toppled the world’s largest pile driver at that time, which was being deployed for construction for the 17.6-mile-long Chesapeake Bay Bridge-Tunnel.
All told, the storm led to 40 fatalities and some $200 million in damage, or more than $1.8 billion in 2022 dollars.
In a 1963 report, the U.S. Corps of Engineers described the system as “the most unexpected storm, most complex in structure, most unusual in behavior and most devastating to the beaches, dunes and barrier islands.”

The Delmarva Peninsula was especially hard hit – particularly Ocean City, Maryland. At that point, Ocean City was a modest beach town, with homes lining the road where high-rise hotels and condos now soar. “Along with the high tides came a continuous hard rain, [60-mph] winds, and 25-foot waves,” notes an overview from the Maryland Center for History and Culture. “Ocean City was soon torn apart. Cars were buried in up to five feet of sand. Houses were ripped away from their foundations and into the sea.”
Surveying the damage by helicopter, Maryland governor Millard Tawes said, “This is the worst disaster in the history of Maryland in my time.”
The storm surge as well as the storm tide (the combination of storm surge and astronomical tide) set all-time records at Lewes, Delaware, that have yet to be topped.
New Jersey was also walloped with coastal flooding: Several locations set records for high water produced by a non-tropical cyclone. And although the storm was a relatively dry nor’easter in New England, winds gusted to 84 mph at Block Island, Rhode Island.
There was one quirky silver lining to the Ash Wednesday storm. Plans were under way in 1962 to develop 15 miles of coastline on the pristine barrier island of Assateague, Virginia. More than 5800 lots had been sold on what was to be called Ocean Beach. But after both Assateague and Chincoteague islands were inundated by the Ash Wednesday storm, pressure from local citizens led Congress to establish the Assateague Island National Seashore.
What if the Ash Wednesday storm happened today?
The NOAA Tides and Currents website includes links to the most extreme water levels at major coastal observing sites, as well as a Sea Level Trends page for each location. These trends are depicted as linear averages, typically from 1919 to 2020 where data permits. We know that sea level rise is actually accelerating, so we can extrapolate from this linear assumption and get a slightly conservative estimate of how much mean sea level (MSL) has risen from 1962 to 2022.


Here are the mean sea level changes at three sample Mid-Atlantic locations with long-term records, based on 1919-2020 data:
- Sandy Hook, New Jersey: 4.15 millimeters/year
- Lewes, Delaware: 3.57 millimeters/year
- Sewells Point, Virginia (Norfolk): 4.73 millimeters/year
With these numbers, we can calculate rough estimates of how much higher the peak storm tides from Ash Wednesday 1962 and other historic high-water days would be if these storms were to strike with mean sea level near its 2022 value, all else being equal (including the same astronomical tides).
Sandy Hook, New Jersey:
The Ash Wednesday storm produced record-high water for any storm up to that point. The record was later eclipsed by a December 1992 nor’easter (which produced a 7.06-foot storm tide, as shown below, that included a 6.79 foot storm surge, one of the highest storm surges on record for a non-tropical storm) as well as by Hurricanes Irene (2011) and Sandy (2012). However, if each of these events occurred atop this year’s mean sea level, then the 1962 storm tide would be higher than in any of them except for Sandy.
| 1962 storm | 6.71 feet on 3/7/62 | 7.53 feet today |
| Sandy | 9.45 feet on 10/29/12 | 9.58 feet today |
| Irene | 7.06 feet on 8/28/11 | 7.19 feet today |
| Dec 1992 | 7.06 feet on 12/11/92 | 7.45 feet today |
Lewes, Delaware:
Ash Wednesday still holds the record for peak high water at Lewes from any tropical or non-tropical storm. Putting the top three events atop today’s mean sea level would only increase the margin by which 1962 is the record-holder.
| 1962 storm | 6.99 feet on 3/7/62 | 7.68 feet today |
| 1998 storm | 6.29 feet on 8/28/98 | 6.57 feet today |
| 2016 storm | 6.92 feet on 1/23/16 | 6.98 feet today |
Sewells Point, Virginia:
Ash Wednesday ranks as the fifth-highest storm tide on record and the highest from any non-tropical nor’easter. If each of these storms happened now, Ash Wednesday would rival Hurricane Isabel from 2003, producing water as high as any tropical or non-tropical storm outside of the landmark 1933 hurricane.
| 1933 hurricane | 6.67 feet on 8/23/33 | 8.05 feet today |
| Isabel | 6.54 feet on 9/18/03 | 6.82 feet today |
| Ex-Ida | 6.32 feet on 11/12/09 | 6.50 feet today |
| 1962 storm | 5.87 feet on 3/7/62 | 6.80 feet today |
Making high water even higher
It’s no secret that the Mid-Atlantic is in the crosshairs of sea-level rise. Subsidence beneath the coast is accentuating the rise regionally. Moreover, weakening of the Gulf Stream – a phenomenon already being analyzed and predicted to continue – will allow higher water now held to the east by Gulf Stream dynamics to push west into the coast, further exacerbating the East Coast’s mean sea-level rise.
NOAA’s new estimates of sea-level rise, an update of a product first issued five years ago, paint an ominous picture for the Mid-Atlantic. It’s not that the mean sea level forecasts themselves have gotten more dire. In fact, the most extreme scenario for 2050 has been dropped, and the other five scenarios (low, intermediate-low, intermediate, intermediate-high, and high) have been lowered somewhat, based on more recent modeling. Also, satellite-based observations now extend over a longer period, lending confidence to an extrapolation of the gradual acceleration depicted in the figure above over the next several decades.
This near-term outlook isn’t as rosy as it might sound. That’s because the very lowering of the highest-end outcomes means that the scenarios as a group are now more tightly clustered – itself a sign of increased confidence. That’s especially true in the period between now and 2050, when the preconditions of greenhouses gases and warming already in the system will be the main driver.
The 2050 benchmark, a new element of focus in the NOAA update, is unsettling in its relative nearness. It’s less than the span of a new 30-year mortgage, for example, and less than the career arc of a twenty-something who’s just now starting full-time work.
As we’ve discussed in previous posts, the gradual increase in mean sea level is leading to a much more dramatic increase in tidal flooding that can be destructive even if it arrives on an otherwise sunny, placid day. For example, both New York City and Norfolk now see 10 to 15 days of minor to disruptive high-tide flooding per year, compared to an average of only about 5 days in 2000.
“Much of the coastline is already close to a flood regime shift,” the new report warns.
As the report stresses, some locations along the U.S. coast are expected to see a foot or more of sea level rise between now and 2050, including 10-14 inches on the East Coast and 14-18 inches on the Gulf Coast. That compares to an average U.S. rise of about 11 inches over the past century. In other words, rather than having 100 years to adapt to roughly a foot of sea level rise, there will now be less than 30 years – and that’s with far more development already baked into the Mid-Atlantic’s coastal environment.
Looking further out, at least two feet of sea level rise is now likely by 2100, according to the report. Major emissions cuts in the short term can help reduce that risk – although most of the projected rise between now and 2050 will have to be planned for and adapted to regardless of emissions cuts.
The Intergovernmental Panel on Climate Change brought home the danger of simultaneous risks on February 28 with the second of three volumes from its Sixth Assessment Report, this one on impacts, adaptation, and vulnerability. As the Summary for Policymakers notes: “Climate change impacts and risks are becoming increasingly complex and more difficult to manage. Multiple climate hazards will occur simultaneously, and multiple climatic and non-climatic risks will interact, resulting in compounding overall risk and risks cascading across sectors and regions. Some responses to climate change result in new impacts and risks.”
Also see: New IPCC report highlights urgency of climate change impacts
Suffice it to say that if a storm like Ash Wednesday 1962 strikes again, there is now much more property for it to demolish and many more lives for it to complicate. And of course, it’ll be riding atop an ocean surface that’s being pushed ever higher by a warming climate.
Jeff Masters contributed to this post. Special thanks go to Hugh Cobb, retired branch chief of the National Hurricane Center’s Tropical Analysis and Forecast Branch, for storm surge calculations and insights on the 1962 storm.
Website visitors can comment on “Eye on the Storm” posts. Comments are generally open for 30 days from date posted. Sign up to receive email announcements of new postings here. Twitter: @DrJeffMasters and @bhensonweather
Source link