
The surface waters of the eastern tropical Pacific continue to heat up, hitting a key threshold on Monday as El Niño organizes. Seasonal forecast models are increasingly pointing toward higher-end El Niño conditions by later this year – and the planet has only experienced a strong El Niño event twice in this century.
In its weekly update issued on June 26, NOAA announced that the weekly sea surface temperature (SST) across the benchmark Niño3.4 region in the tropical Pacific had risen to 1.0 degrees Celsius above the seasonal average. This is the highest weekly value since El Niño conditions were officially declared by NOAA in May. El Niño is a large-scale warming of the eastern tropical Pacific, whereas La Niña is a large-scale cooling of the same area.
A Niño3.4 SST value of at least 0.5°C above average corresponds to a weak El Niño event, 1.0°C moderate, and 1.5°C strong, all provided that the atmospheric circulations linked to El Niño are also in place (which they are).
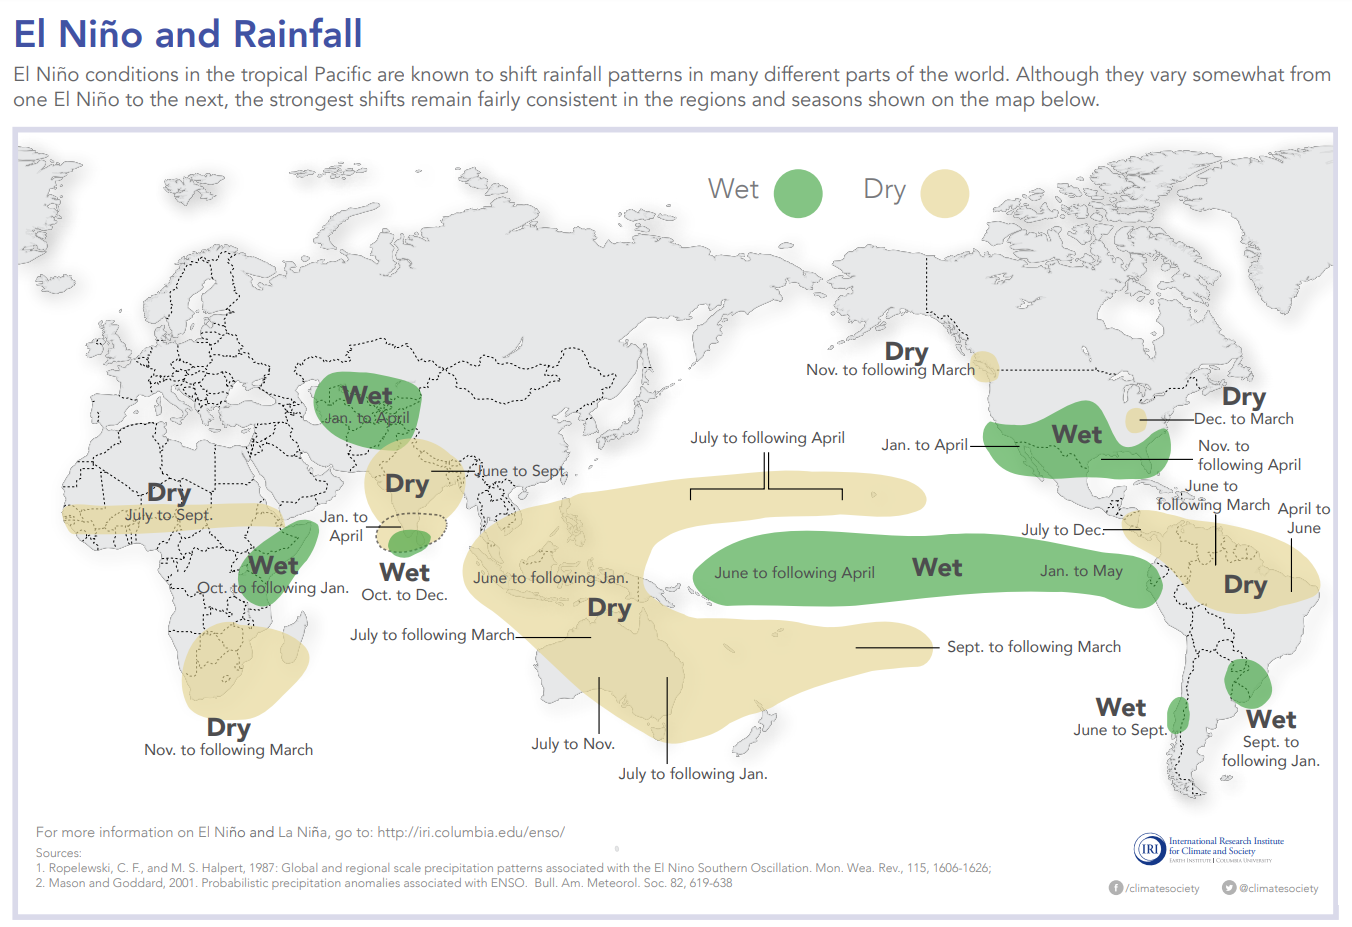
Compared to average, the tropical Pacific is especially warm this month on its far eastern end, off the coast of South America. Should this continue, it’ll point toward a “classic” El Niño event (as opposed to one where the peak warming is thousands of miles west). Classic events are more likely to produce the classic El Niño effects on weather and climate, which range from drought in Indonesia to a mild, wet winter across much of the southern U.S. (see below).

The warming of the Niño3.4 region could pause for a week or more at any point, but overall El Niño is expected to intensify as we move into the second half of 2023. The consensus forecast issued in June by a suite of 17 dynamical forecast models from around the world (thick red line in Figure 1 below) is for a strong El Niño event that will peak during autumn and wane by early 2024. Statistical models, which are generally older and less powerful, predict only a weak event; however, we can largely discount those models given recent SST trends.

A bookkeeping note: Much like an economic recession, an El Niño event is often not deemed full-fledged until it’s well underway. In order for ongoing El Niño conditions to be considered an El Niño event for long-term archives and research, the three-month average of the Niño3.4 SST must be at least 0.5°C above average for at least five overlapping periods (e.g., May-June-July through September-October-November). So although NOAA agrees that El Niño conditions are now in place, those conditions will have to continue through at least autumn in order for this episode to earn its place as the El Niño event of 2023 (or 2023-24, should it persist long enough).

What to expect?
Figure 3 above shows the prototypical effects of El Niño on global precipitation by season and location. It’s crucial to remember that El Niño tilts the odds, but it doesn’t make any guarantees. For example, California now has a fair shot at its second wet winter in a row during 2023-24 – which would be astounding in light of the megadrought that began around 2000. But not every El Niño is generous with precipitation in California, as thoroughly documented by Jan Null (Golden Gate Weather Service) on his “El Niño and La Niña Misconceptions” web page.

Tropical update: Action shifts toward the Northeast Pacific
Conditions across the tropics on either side of the Americas will move closer to what we’d expect during El Niño over the coming days. Thus far, the Atlantic has been spinning up storms at a near-record pace for late June, while the Northeast Pacific hasn’t yet had a tropical cyclone. In fact, it’s one of the latest starts to the Northeast Pacific season in satellite-era records dating back to 1970. Typically, El Niño leads to increased activity in the Northeast Pacific and less activity than usual in the Atlantic, especially as we move forward through the season. However, the National Hurricane Center tagged two areas of interest south of Mexico in its Tropical Weather Outlook on Monday, both of which are likely to spawn at least a tropical depression in the Northeast Pacific this week. Since 1970, the latest occurrence of the first named storm in the Eastern Pacific was Agatha on July 2, 2016.
In the Atlantic, Tropical Storms Bret and Cindy both dissipated over the weekend, but as of Monday afternoon, there was is a 30% chance that Cindy’s remnants will regenerate in the Atlantic subtropics later this week as they head toward Bermuda. Further south, across the Main Development Region of the Atlantic, this month’s active wave train may be suppressed for awhile by the year’s first major outbreak of Saharan dust.
Jeff Masters contributed to this post. Website visitors can comment on “Eye on the Storm” posts (see comments policy below). Sign up to receive notices of new postings here
Source link